
First off, I am all about diversity, and not just in the workplace, but in life. So, this exercise was not undertaken to dispel the results, but to whet my curiosity and being a data person, those reported numbers just seemed off…
![]() So, I went off on a run down a rabbit hole (for more hours than I care to admit, smile…) and have found some very positive data point trends underlying these numbers worthy of sharing.
So, I went off on a run down a rabbit hole (for more hours than I care to admit, smile…) and have found some very positive data point trends underlying these numbers worthy of sharing.
Obviously, still MUCH more to be done in multiple areas:
#1 – The survey is statistically correct across the 190,000+ active bar members in California, but… of the 225+K surveyed, only 7.6% responded… Boo on the 92.4% that could not be bothered to participate.
Oh, and yeah, 50+% of the respondents only took the short or shorter versions of the survey.
![]()
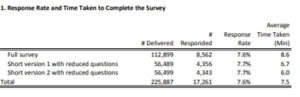
However, from a cursory review of acceptable standards for sampling, this survey provides a .72% -.94% degree of accuracy in the results (95%-99% respectively).
#2 – Take the time to review the demographics pages starting on page 13, some interesting trends appear (IF you can trust this sample size.)
Gender: A higher % of females than males are licensed to practice law in California with less than 20 years’ experience… DID NOT EXPECT THAT.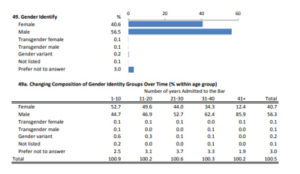
However, with 30+ years in legal, my “eye test” tells me these stats are likely accurate.
However, my eye test does not fail when considering these stats vs. inclusion and leadership roles.
Race/Ethnicity: Similar stats – reduction in declared white% respondents in the less than 20 years practiced buckets.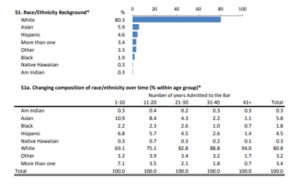
If you dig deeper into California census data, birth/death rates, economic and race data, immigration data, education and first-time family college attendance, these stats make sense, and a dive into “base” California U.S. census data reveals socio-economic pattern shifts relative to non-white participants, as well.
So, after a run down the rabbit hole, numbers never lie and there are positive trends to report.
With the focus and attention being brought to diversity and inclusion, it portends for additional positive trends in the coming years.
But, and I believe this is a HUGE BUT, these stats are taken from my home state of California, known for its progressive liberal agenda. It would be interesting to see an overlay versus other parts of the country and determine if there are any areas of correlation.
As an aside, #3 The whole gender identity/sexual orientation section probably could use a refresh/rework, as my gut tells me this sample is not accurate and the capture questions may contribute to that.
If you are a bit of a data weirdo like me, It’s actually an interesting read
http://www.calbar.ca.gov/About-Us/Who-We-Are/Bar-Numbers
Michael White